On wiggly lines and being normal
29 Nov 2016

Not too long ago I found myself concentrating on breathing normally. Sitting at the end of a wire, a mask strapped to my face, listening to the hiss of the machine that was keeping me supplied with air, and trying not to be flummoxed by the two life-size glass heads that seemed to be staring at me, all I could think was “how do I breathe, normally?”
If someone asks you to “walk normally” or “hold a smile” - or even enquires what you do with your thumbs when you’re running - a sort of macroscopic Heisenberg Principle comes into play. The act of self-observation totally changes the thing being observed. And so it has been for me at work recently, what with the breathing in, and the breathing out, and the holding my breath, and thinking about breathing, periodically filling my lungs right to the very top/bottom just to check they still work, and blowing out with a big sigh, all because Owlstone are engaged in a rather exciting project. We hope that the company’s chemical detection technology might be able to diagnose disease from chemicals on breath. In the early research, people’s breath is sampled before being shipped to the labs for analysis: a harder problem than it initially sounds.
I volunteered to test our breath sampler: that was the thing that had me concentrating on breathing normally. This clever device goes over yer face and monitors pressure and CO2 (amongst other things) while you breathe. Tiny pumps turn on at different points in the breathing cycle to drag different parts of the breath onto various sample tubes, where the chemicals are trapped in a matrix. It “decides” when to actuate the pumps based on the time-varying levels of pressure and carbon dioxide. My favourite part of the whole thing, and the inspiration (hah!) for this post is the plotting of these signals as wiggly lines against a time axis. You can sit and watch them, mesmerically rising and falling… It might be quite meditative if it weren’t for the mask, the clinical setting, the glass heads, the wires and the hissing.
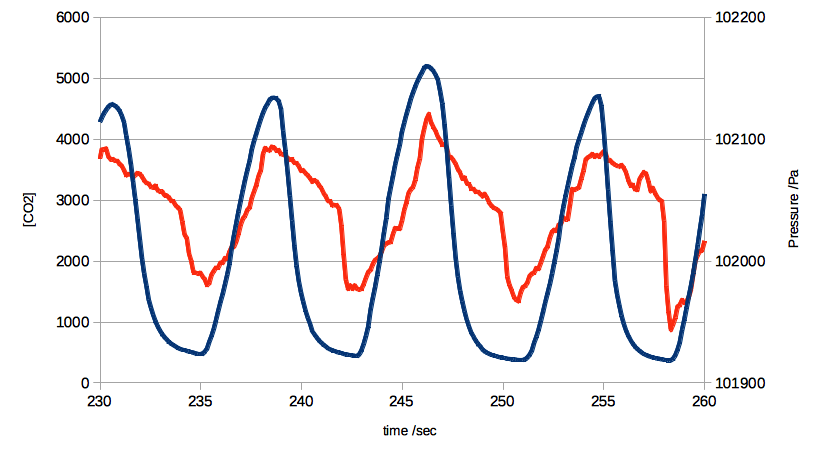
My breath, Cartesian style
Being a geek, I love wiggly lines. I find it difficult to stop my brain (and often, my pen) sketching functions as soon as I hear them defined. Thanks to M. Descartes I tend to follow convention and think in terms of y against x, or in terms of x against time t. That’s how, by default, the ReCIVA breath sampler displays them, too. While I sat watching my own breath signals I wondered about visualising them differently. What if I could see pressure against CO2? Two out-of-phase sinusoidal signals ought to produce an ellipse, right? Turns out they do, nearly:
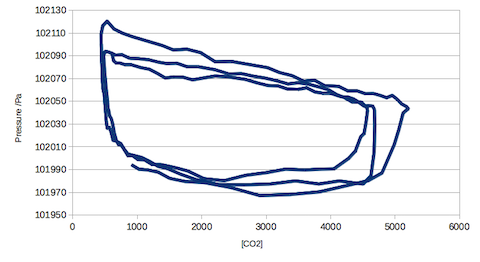
My breath, less conventional Cartesian style
In this representation of the data, my breath signals go round and round a rough central point as time passes, tracing out a wobbly egg shape. I find it easier to understand the meaning of the term “phase” in this view of things: for me, it maps more naturally onto the angle inside the “circle”.
I enjoy these translations from the geometric domain to the physical. A while back, my friend Quentin shared some other wiggly lines with me. They track a drive (the x-axes represent time). Can you spot the roundabout? What can be deduced about the (approximate) “odd"ness of the “steering” signal (taking t=320 as the centre)?
Here are a couple of other “functional” imaginings I’ve enjoyed:
- What does ⌊y⌋= ⌊x⌋look like? (floor function) Try and sketch it before you look up the answer
- What does y = x^x look like? (x to the power x) For what value(s?) of x does it have a minimum?
- How do your chances of dying vary across the days of the year, on average?
- Plot the age of the oldest person alive across time from 150 years ago to today
Tags: work, maths, data, owlstone
< Previous post | Next post >Favourite posts
- On wiggly lines and being normal
- On infinite villages
- Running a race backwards
- Brainmaking
- Their tables were stored full, to glad the sight
- The structure of a smell
Recent posts
Blog archives
Posts from 2012, 2013, 2014, 2015, 2016, 2017, 2018, 2019, 2020, 2021, 2022, 2023, 2024, 2025, 2026.